Yun-Bin Jiang1,
Mei Zhong2,
Ming-Xun Hu1,
Ling Chen1,
Yan Gou3,
Juan Zhou3,
Pi-E Wu3,
Yu-Ying Ma1 ![]()
For correspondence:- Yu-Ying Ma Email: cdtcmma@163.com
Received: 10 September 2016 Accepted: 11 January 2017 Published: 25 February 2017
Citation: Jiang Y, Zhong M, Hu M, Chen L, Gou Y, Zhou J, et al. Spectrum-effect relationships between high performance liquid chromatography fingerprint and analgesic property of Anisodus tanguticus (Maxim) Pascher (Solanaceae) roots. Trop J Pharm Res 2017; 16(2):379-386 doi: 10.4314/tjpr.v16i2.17
© 2017 The authors.
This is an Open Access article that uses a funding model which does not charge readers or their institutions for access and distributed under the terms of the Creative Commons Attribution License (http://creativecommons.org/licenses/by/4.0) and the Budapest Open Access Initiative (http://www.budapestopenaccessinitiative.org/read), which permit unrestricted use, distribution, and reproduction in any medium, provided the original work is properly credited..
Purpose: To investigate the spectrum-effect relationships between high performance liquid chromatography with photodiode array detection (HPLC-DAD) fingerprint and analgesic activity of Anisodus tanguticus (Maxim.) Pascher (Solanaceae) (AT) roots.
Methods: Analgesic activity of AT roots was evaluated by acetic acid-induced writhing test in mice. Fingerprint of AT roots was established by HPLC-DAD. After oral administration of AT roots extract, intra-gastric contents of caffeoylputrescine, anisodine, fabiatrin, scopolin, scopolamine, anisodamine and atropine in mice were determined by HPLC-DAD. Spectrum-effect relationships between HPLC-DAD fingerprint and analgesic activity were investigated using bivariate correlation analysis.
Results: Following treatment with different batches of AT roots extract, acetic acid-induced writhing responses in mice were inhibited significantly (p < 0.05 or 0.01), with inhibitions of 26.62 - 55.13 %, relative to the control group. Sixteen common peaks were obtained by fingerprint analysis. Peaks 1, 2, 6, 7, 8, 9 and 12 were identified as caffeoylputrescine, anisodine, fabiatrin, scopolin, scopolamine, anisodamine and atropine, respectively. Bivariate correlation analysis between analgesic activity of AT roots and 16 common peaks areas indicated the contributions of 16 common peaks to analgesic activity of AT roots. Surprisingly, bivariate correlation analysis between analgesic activity of AT roots and intra-gastric contents of above-named 7 constituents revealed that the contributions of the 7 constituents to analgesic activity of AT roots were different from those based on their peak areas.
Conclusion: This study provides scientific justification for the investigation of the active constituents of AT root with a view to its standardization
Introduction
The main chemical constituents of Anisodus tanguticus (Maxim.) Pascher (Solanaceae) (AT) roots are alkaloids, flavonoids, coumarins and phenolcarboxylic acid [1]. Existing reports about AT roots are primarily focused on contents of the main alkaloids anisodamine, anisodine, scopolamine and atropine [2-4]. It is recorded in Chinese Tibetan medicine and China flora that AT roots exhibit sedative, analgesic and antitussive activities, but there have been no studies to confirm these pharmacologic effects [1,5].
AT roots have been used as raw material in the extraction of tropane alkaloids for a long time [5]. With increasing demand for tropane alkaloids, the demand for AT roots is growing rapidly [6]. To avoid wastage of AT roots during extraction of tropane alkaloids, a feasible solution is to promote their application as medicinal herbs for treating diseases. The scientific quality standard of AT roots is a pre-condition for their use in treating diseases. Quality standards of medicinal herbs in Chinese Pharmacopoeia show that quantitative determinations of active constituents are very important in assessing the quality of medicinal herbs [7].
This study aimed at investigating he active constituents of AT roots through spectrum-effect relationships, an acceptable method used to exploring the active constituents of medicinal herbs [8,9]. Spectrum-effect relationships between high performance liquid chromatography with photodiode array detection (HPLC-DAD) fingerprint and analgesic activity of AT roots were investigated using bivariate correlation analysis.
Methods
Plant material
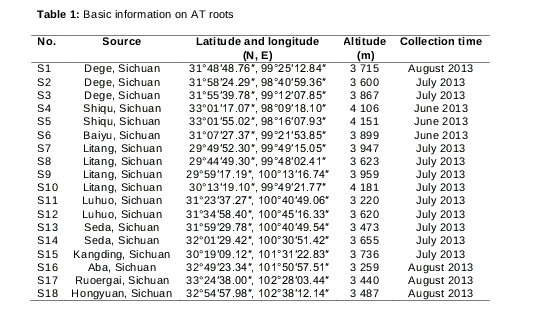
Eighteen batches of AT roots () were collected from different districts of Sichuan Province in China and identified by Prof Yu-Ying Ma, a taxonomist in the College of Pharmacy, Chengdu University of Traditional Chinese Medicine. The voucher specimens of AT roots (voucher no. Sldjiang/CDUTCM S1 - S18) were deposited at the Herbarium of Chengdu University of Traditional Chinese Medicine for future reference.
Instrumentation, chemicals and reagents
HPLC analysis was carried out on LC-20AT (SHIMADZU, Japan). HPLC grade acetonitrile and methanol were purchased from Fisher (Fisher Scientific, Germany). Analytical grade KH2PO4, H3PO4, hydrochloric acid, ethanol, acetic acid and sodium carboxyl methyl cellulose (CMC-Na) were purchased from Chengdu Kelon Chemical Reagent Factory (Chengdu, China). Ultra-pure water was prepared by Milli-Q Advantage A10 (Millipore, USA). Enteric-coated aspirin tablets were purchased from Yabao Pharmaceutical Group Co., Ltd. (Taiyuan, China). Anisodine hydrobromide, scopolamine hydrobromide, anisodamine hydrobromide and atropine sulfate were purchased from National Institutes for Food and Drug Control (Beijing, China), and their purities were 100, 91.7, 99.4 and 96.5 %, respectively. Caffeoylputrescine, fabiatrin and scopolin were separated from AT roots, and their purities were 97.6, 97.6 and 94.6 %, respectively.
Animals
Specific pathogen-free male and female KM mice (mean weight = 20 ± 2 g) were purchased from Chengdu Dashuo Laboratory Animal Co. LTD (Chengdu, China).
All mice were housed in a temperature-controlled vivarium (25 °C) with relative humidity of 65 % and 12/12-h light-dark cycle. They were given water and feed ad libitum. All animal treatments were conducted in strict compliance with the National Institutes of Health Guide for Care and Use of Laboratory Animals [10]. All animal experiments in this study were performed with the approval of the Ethics Committee of Chengdu University of Traditional Chinese Medicine (protocol no. CDUTCM 20150412).
Sample preparation for acetic acid-induced writhing test
AT roots (10 g/batch) were ground into powder and extracted 6 times by cold maceration in 50 mL of ethanol (95 %) containing 0.1 % hydrochloric acid with intermittent shaking at 3 h intervals for 24 h. The extracts were combined and concentrated under reduced pressure to yield a crude extract (10 mL). The extract was diluted 10 times with 0.5 % CMC-Na to obtain the pharmacodynamic sample.
Animal grouping and treatment
The mice were randomly divided into 20 groups (n = 10): control, aspirin and S1 - S18 groups. Mice in the aspirin group were administered aspirin at a dose of 0.1 g/kg once a day for 5 days. Prior to administration, aspirin was ground into powder and then dissolved in 0.5 % CMC-Na to obtain a concentration of 0.005 g/mL. Mice in the S1 - S18 groups were administrated the corresponding AT roots extract at a dose of 2 mL/kg (crude extract/mice body weight) once a day for 5 days, respectively. Mice in the control group received 0.5 % CMC-Na once a day for 5 days. All treatments were given by gavage (20 mL/kg). After 30 min of drug treatment on the 5th day, mice in all groups were injected intraperitoneally with 0.7 % acetic acid at a dose of 10 mL/kg. Fifteen minutes after the acetic acid injection, the number of writhes of each mouse were determined. The % inhibition (H) of writhing response by aspirin or AT roots extract were calculated as in Eq 1.
H (%) = {(A – B)/A}100……………………. (1)
where A and B stand for the number of writhes in the control group and the aspirin or S1 - S18 groups, respectively.
Sample preparation for HPLC analysis
Sample preparation for HPLC analysis was the same as that for acetic acid-induced writhing test, except for the last dilution. In this case, the AT roots extract sample for HPLC analysis was diluted 20 times with methanol. The diluted extract was filtered through 0.2 μm membrane before HPLC analysis.
Preparation of mixed standard solutions
Appropriate quantities of anisodine, scopolamine, anisodamine and atropine were dissolved in methanol to produce 3.497, 0.229, 0.827 and 0.353 mg/mL of stock solutions, respectively. Appropriate quantities of caffeoylputrescine, fabiatrin and scopolin were dissolved in 60 % methanol to produce 1.188, 1.761 and 1.058 mg/mL of stock solutions, respectively. Appropriate volume of stock solution of the 7 constituent standards were added into same volumetric flask and diluted with methanol to obtain a series of mixed working standard solution of different concentrations.
HPLC conditions
HPLC analysis was performed on Shimadzu LC-20AT, equipped with a binary solvent delivery pump, an auto sampler and a DAD detector; and connected to Empower 2 software. The chromatographic separation was carried out on an Inertsil ODS-SP C18 (4.6 mm × 250 mm, 5 μm), operated at 30 ºC. The mobile phase was composed of acetonitrile (A) and 10 mmol/L KH2PO4 buffer solution (B; the pH was adjusted to 3.0 with H3PO4), with a linear gradient of A: 0 - 5 min (10 %), 5 - 40 min (10 – 25 %), 40 - 41 min (25 – 90 %), 41 - 50 min (90 %), 50 - 55 min (90 – 10 %) and 55 - 60 min (10 %). The injection volume and the flow rate were 10 μL and 1.0 mL/min, respectively. Detection wavelength of HPLC fingerprint and determination of contents of anisodine, scopolamine, anisodamine and atropine was 210 nm, while detection wavelength for caffeoylputrescine was 317 nm. Detection wavelength for contents of fabiatrin and scopolin was 339 nm. HPLC chromatogram of 0 - 40 min was recorded and used to analyze HPLC fingerprint and determine the levels of the above-named 7 constituents.
Validation of HPLC method
Precision, stability within 24 h and repeatability were used to validate the HPLC fingerprint method. Precision, stability within 24 h, repeatability, limit of detection (LOD), limit of quantitation (LOQ) and linearity range were used to validate the content determination method for the above-named 7 constituents. Precision, stability and repeatability were used to assess instrument performance, stability of target constituent and operation consistency, respectively [11]. LOD and LOQ were deemed to be the content that came into being a signal to noise (S/N) of 3 and 10, respectively. Linearity range was used to assess the linear relationship between injection content of target constituent and its peak area.
Statistical analysis
Data from acetic acid-induced writhing test are presented as mean ± standard deviation (SD). Differences among different groups were analyzed by one-way ANOVA on SPSS 21.0, and were considered to be statistically significant at p < 0.05 or 0.01. Common peaks and similarities among different batches of AT roots were evaluated by Similarity Evaluation System for Chromatographic Fingerprint of TCM (SESCF, Version 2004A). Bivariate correlation analysis between % inhibition of AT roots extract against writhing responses and common peak areas, or intra-gastric contents of the 7 constituents (caffeoylputrescine, anisodine, fabiatrin, scopolin, scopolamine, anisodamine and atropine) in mice was performed with Pearson's correlation coefficient on SPSS 21.0.
Results
Inhibitory effect of AT roots extract on acetic acid-induced writhing responses
Compared with the control group, the acetic acid-induced writhing responses in the aspirin group were significantly inhibited (p < 0.01), with inhibition of 65.40 %, indicating that the acetic acid-induced writhing model and positive drug aspirin were successfully established and administrated, respectively. After treatment with AT roots extract (S1 - S18), the acetic acid-induced writhing responses were significantly reduced (p < 0.05 or 0.01), with inhibitions of 26.62 - 55.13 %, compared with the control group. These results are shown in .
Validation of HPLC fingerprint method
The results of precision, stability within 24 h and repeatability indicated that the relative standard deviation (RSD, n = 6) of retention time and peak area values of 16 common peaks were less than 2 %, suggesting that the method was suitable and feasible for analyzing HPLC fingerprint of AT roots extract [12].
Content method validation of test constituents
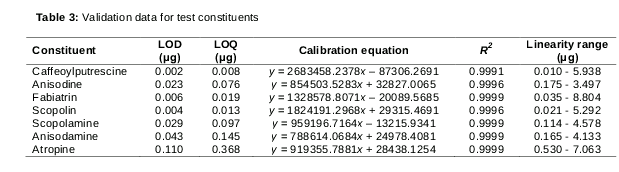
The results of precision, stability within 24 h and repeatability revealed that the RSD of the peak areas (n = 6) were less than 2 %. The LOD, LOQ, calibration equation, coefficient of determination (R2) and linearity range are presented in . The calibration equation was generated according to the linear relationship between peak area values (Y) and injection content (X μg) of standard. These results showed that the method was suitable and feasible for determination of the contents of the test constituents (caffeoylputrescine, anisodine, fabiatrin, scopolin, scopolamine, anisodamine and atropine).
HPLC fingerprint analysis
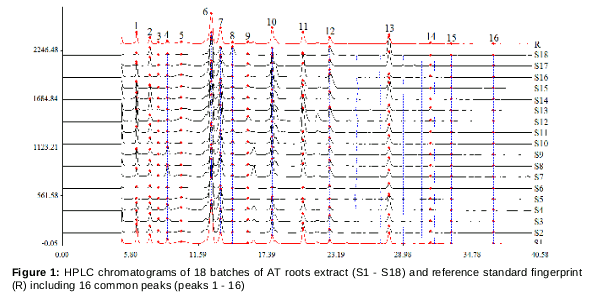
The HPLC chromatograms of 18 batches of AT roots extract were imported into SESCF to generate reference standard fingerprint including 16 characteristic peaks (common peaks) by multipoint correction and peak matching (). Similarities among HPLC chromatograms of 18 batches of AT roots extract and reference standard fingerprint were analyzed. The RSD of the 16 common peaks areas in 18 batches of AT roots samples were all higher than 40 %, indicating that the areas of each common peak in different samples varied widely. The similarities among HPLC chromatograms of 18 batches of AT roots extract were in range 0.661 - 0.985. Similarities between HPLC chromatograms of 18 batches of AT roots extract and reference standard fingerprint were in range 0.811 - 0.988.
Identification of common peaks
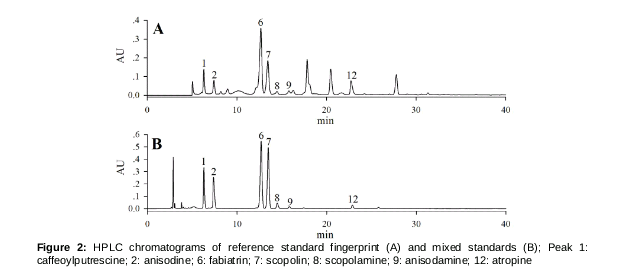
The common peaks 1, 2, 6, 7, 8, 9 and 12 were identified as caffeoylputrescine, anisodine, fabiatrin, scopolin, scopolamine, anisodamine and atropine, respectively, by comparing retention time and ultraviolet absorption curves of target peaks with those of standards ().
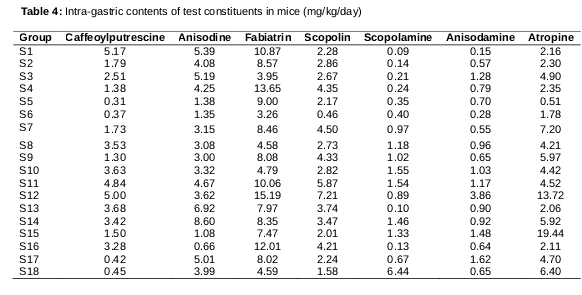
Intra-gastric contents of test compounds in mice
The content of each constituent in HPLC sample was calculated from its peak area and standard curve (). The intra-gastric content of each target constituent in mice (mg/kg/day) was then calculated according to its content in HPLC sample, difference between HPLC and pharmacodynamic sample, and intra-gastric volume. These results are shown in .
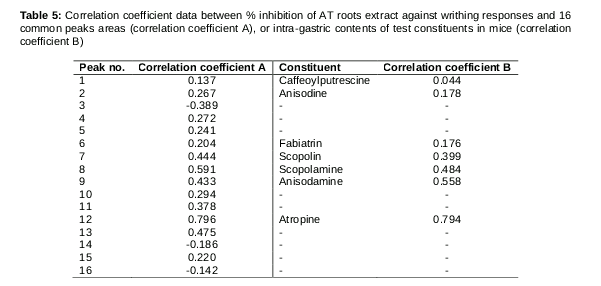
Bivariate correlation analysis
Bivariate correlation analysis between % inhibition of AT roots extract against writhing responses and 16 common peaks areas, or intra-gastric contents of test constituents in mice were performed with Pearson's correlation coefficient on SPSS 21.0. The results of bivariate correlation analysis between % inhibition of AT roots extract and 16 common peaks areas (: correlation coefficient A) showed that the contributions of 16 common peaks to analgesic activity of AT roots extract were in the following order: peak 12 (atropine) > 8 (scopolamine) > 13 > 7 (scopolin) > 9 (anisodamine) > 11 > 10 > 4 > 2 (anisodine) > 5 > 15 > 6 (fabiatrin) > 1 (caffeoylputrescine) > 16 > 14 > 3.
The results of bivariate correlation analysis between % inhibition of AT roots extract and intra-gastric contents of test constituents in mice (: correlation coefficient B) indicated that the contributions of test constituents to analgesic activities of AT roots extract were in the following order: atropine > anisodamine > scopolamine > scopolin > anisodine > fabiatrin > caffeoylputrescine.
Discussion
Reports so far show that the main constituents of AT roots are alkaloids [13-15]. Thus it is desirable to increase the efficiency of extraction of alkaloids from AT roots sample preparation. Alkaloids in medicinal herbs are extracted with water or ethanol containing inorganic acid [16,17]. In the present study, ethanol was selected as the extraction solvent because it has
higher extracting capacity than water. The temperature used for concentrating a water extract is higher than that for an ethanol extract. This may result in the decomposition of some constituents of water extract of AT roots. Based on these reasons, acidified ethanol was selected as the extraction solvent for AT roots.
Methanol and acetonitrile are two commonly used organic mobile phases in HPLC. Acetonitrile was selected as the organic mobile phase in this work to obtain steady base line of HPLC chromatogram at 210 nm. Since there are many alkaloids in AT roots, KH2PO4 buffer solution was selected as the aqueous mobile phase to obtain good peak shapes and separation of alkaloids, and the pH value of KH2PO4 buffer solution was adjusted to 3.0 with H3PO4 based on preliminary experiments. The HPLC chromatogram at 210 nm provided more information on constituents, and the maximum absorption wavelength of main alkaloids (anisodine, scopolamine, anisodamine and atropine) was also 210 nm. Thus the HPLC chromatogram at 210 nm was used to establish HPLC fingerprint. The detection wavelengths for the determination of contents of caffeoylputrescine, anisodine, fabiatrin, scopolin, scopolamine, anisodamine and atropine were selected based on their 190 - 800 nm absorption curves.
Acetic acid-induced writhing test is a common model for investigating the analgesic activities of drugs [18]. Aspirin is an accepted drug used to inhibit acetic acid-induced writhing response [19]. Therefore, acetic acid-induced writhing test was used to evaluate analgesic activity of AT roots, with aspirin as positive drug.
The similarity values (0.811 - 0.988) between HPLC chromatograms of 18 batches of AT roots extract and reference standard fingerprint were higher than the similarity values (0.661 - 0.985) among HPLC chromatograms of 18 batches of AT roots extract. This indicated that the 16 common peaks can well represent information on chemical constituents in AT roots extract.
The higher the correlation coefficient is, the higher the contribution of the corresponding peak to analgesic activity of AT roots extract is [20]. The results (: correlation coefficient A) revealed that the contributions of 16 common peaks to analgesic activity of AT roots extract were in the order: peak 12 (atropine) > 8 (scopolamine) > 13 > 7 (scopolin) > 9 (anisodamine) > 11 > 10 > 4 > 2 (anisodine) > 5 > 15 > 6 (fabiatrin) > 1 (caffeoylputrescine) > 16 > 14 > 3. Since the ultraviolet absorptions of different constituents are different, the differences of peak areas among different constituents cannot represent differences in their contents. Therefore, the correlation analysis between % inhibition of AT roots extract against writhing responses and intra-gastric contents of test constituents in mice were further carried out. The results (: correlation coefficient B) indicated that the contributions of test constituents to analgesic activity of AT roots extract were in the order: atropine > anisodamine > scopolamine > scopolin > anisodine > fabiatrin > caffeoylputrescine; and the order and correlation coefficient were different from those based on their peaks areas. This suggests that the result of correlation analysis based on content of constituent may be more convincing than that based on corresponding peak area. This is a novel finding because correlation analyses for spectrum-effect relationships in all existing literature were performed by peak area [21-23].
Conclusion
The spectrum-effect relationships between analgesic activity and HPLC-DAD fingerprint of AT roots were investigated in this study for the first time. The correlation analysis between analgesic activity of AT roots and 16 common peaks areas indicate the contributions of 16 common peaks to analgesic activity of AT roots. Surprisingly, the correlation analysis between analgesic activity of AT roots extract and intra-gastric contents of test constituents show that the contributions of the test constituents to analgesic activity of AT roots are different from those based on their peak areas. This study provides scientific justification for the investigation of the active constituents of AT root with a view to its standardization.
Declarations
Acknowledgement
References
Archives


News Updates